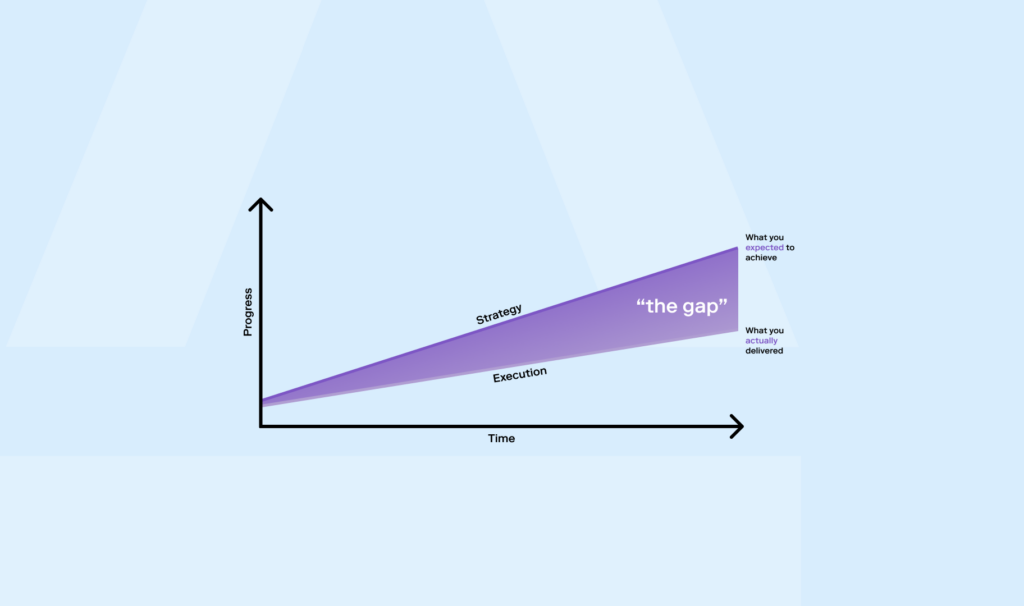
In a tactical delivery environment, success can often be tracked in a binary manner: did the project finish or not? In a strategic environment, this becomes: did the project deliver the intended value?
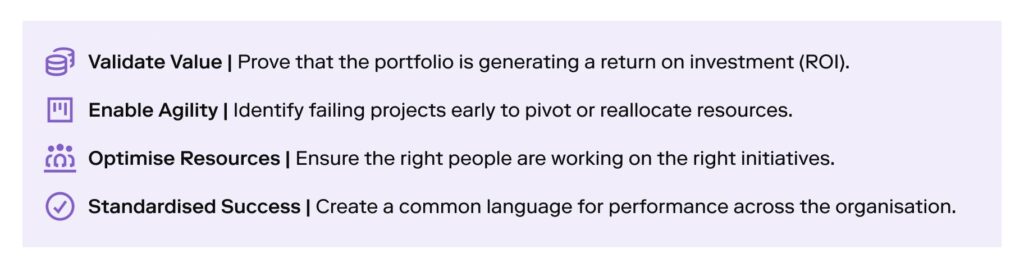
KPIs serve as the navigation system for the PMO and project delivery teams. They bridge the gap between high-level strategic vision and day-to-day execution. Effective measurement enables organisations to:
Common pitfalls in selecting KPIs
However, not every organisation sets itself up for success when it comes to tracking KPIs. Many will find themselves falling afoul of these common pitfalls.
Choosing too many KPIs to focus on
Some organisations fall into the trap of setting up too many KPIs straight out of the gate. This causes the following issues:
- There is confusion around what each KPI means and what it measures.
- The time taken to provide all this information can be onerous.
- The value of tracking so many KPIs is offset by the time taken to review these and make decisions based on them.
Being too focused on the scorecard
The most common pitfall is to only create KPIs that generate a project scorecard or a picture of what has already happened. Whilst lagging indicators provide an important performance scorecard, relying on them exclusively creates a reactive delivery culture. By the time problems become visible, the opportunity for low-cost corrective action may already have passed.
Poor alignment of your KPIs with best practice guidance
Some organisations decide to define their own bespoke KPIs. Whilst there will be a need to tailor best practice guidance to an organisation (a key tenet of PRINCE2), generating these from scratch is likely to cause many issues, most notable in the time it takes to explain these to new starters and key stakeholders and the effort to tailor processes and systems to cater for these.
Understanding the types of KPIs PMOs can look at
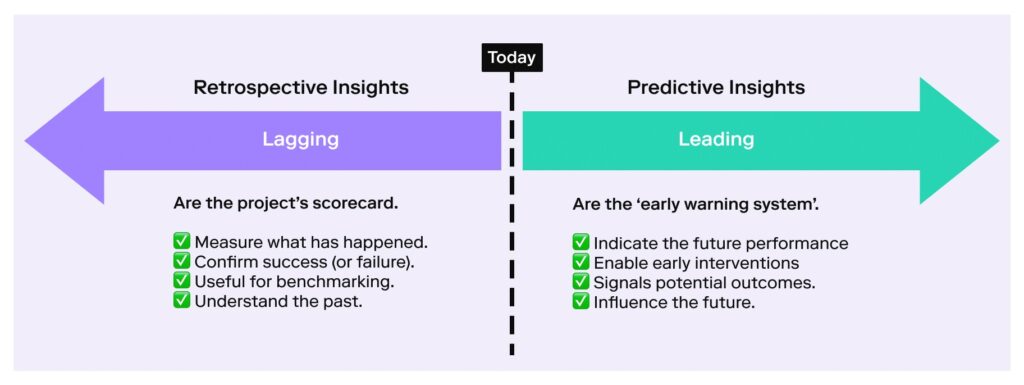
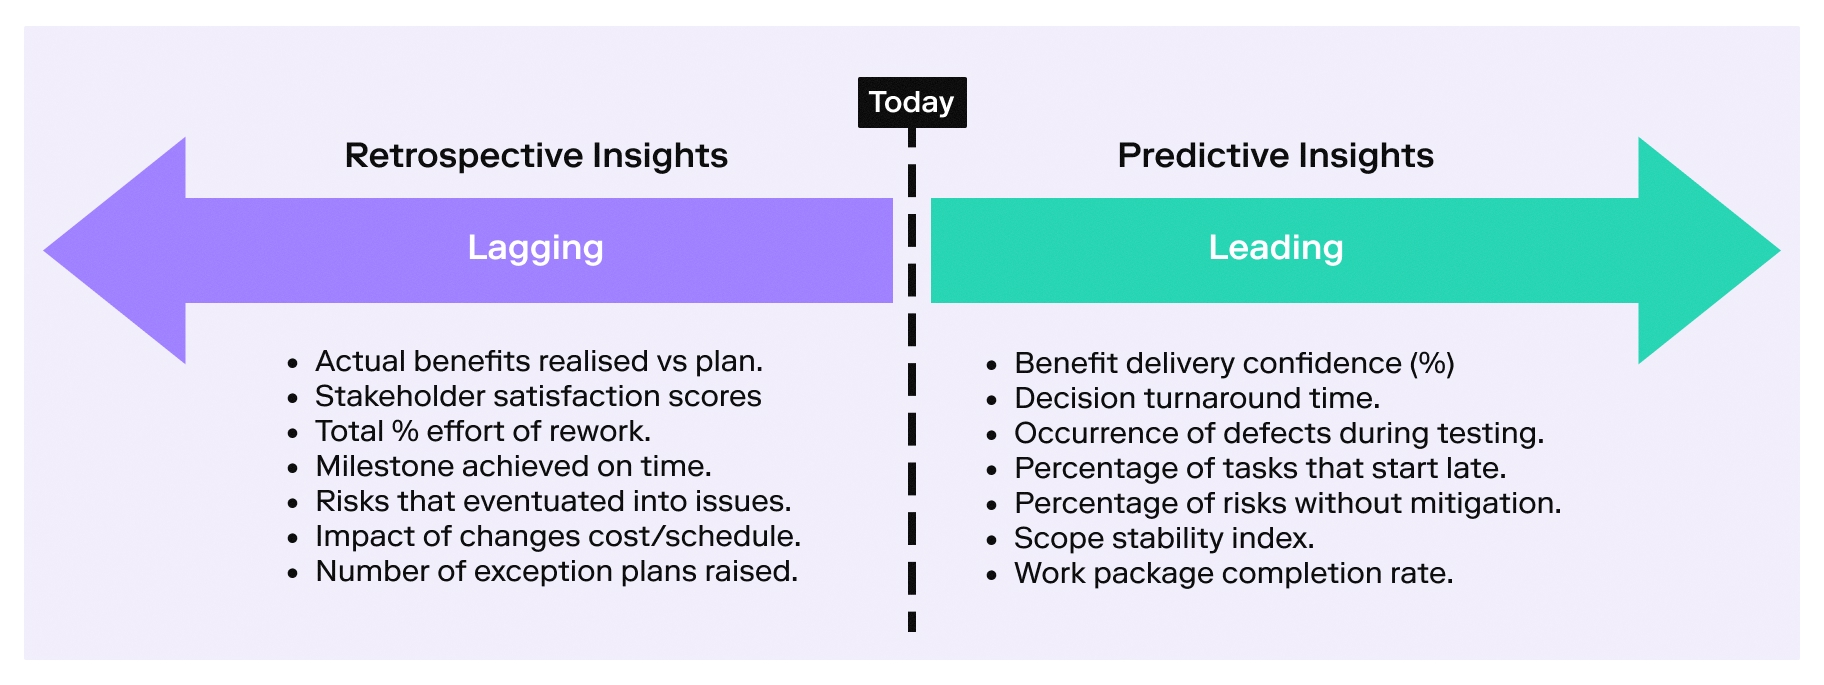
In seeking to avoid the common pitfalls, it’s worth noting the two key types of KPI that can be used to track projects, programs, and portfolios: Leading and Lagging indicators.
The diagram provides clarify on what these are and how they work in symbiosis to provide a complete picture.
Lagging KPIs for a PMO
Are backward-looking and measure what has already happened on a project or program. They are primarily used to assess how successful the project or program has been thus far.
Examples of lagging indicators include but are not limited to:
- Key Milestones | Were these completed on time?
- Project Spend | Has the project spent more than was originally allocated when it was first initiated?
- Benefits Realised | How many have been realised thus far and have they met target values?
These KPIs are generally of more interest to PMO as they measure the current success of a project and as such form part of a portfolio scorecard.
Leading KPIs for a PMO
Are forward-looking and attempt to predict what may happen on a project or program. They are primarily used to flag problems ahead of time so that corrective action can be taken.
Examples of leading indicators include but are not limited to:
- Risk Exposure | What potential events could occur and impact project progress?
- Forecast Costs | How much might the project cost based on actual spend to date and predicted future costs? Does this fall within approved budgets?
- Task Start Date | When are in progress tasks due to start and how might delays impact future tasks?
These KPIs are also useful to the PMO but are invaluable to the project delivery teams. They form the ‘early warning system’ or radar to alert of problems before they happen so that something can be done (corrective action).
Many organisations tend to focus on lagging indicators to inform project success because it’s easy to assess success. However, if you only look at the past you’re not paying attention to where you’re going.
Organisations with mature KPI practices rarely use metrics purely for reporting purposes. Instead, they use them to shape behaviour, improve forecasting confidence, and support earlier decision-making. The true value of KPIs lies not in the production of dashboards, but in the quality of conversations and actions they enable.
At this point, one might be tempted to draw the conclusion that only leading KPIs are valuable and delivery teams should throw their lagging indicators in the bin. However, the perfect sweet spot will be to balance both.
What should KPIs be used to measure in a PMO?
The most obvious and unambiguous KPIs that most organisations choose to track are often:
- Financials | How is the project performing from a budgetary perspective?
- Schedule | How is the project tracking to agreed deadlines?
Certainly, these would form the ‘backbone’ of many organisations’ KPI requirements.
However, this often misses the complete picture.
One of the challenges organisations face is ensuring KPI coverage extends beyond schedule and budget performance alone. Mature PMOs recognise that successful delivery also depends on governance effectiveness, stakeholder engagement, quality management, risk control, and organisational readiness.
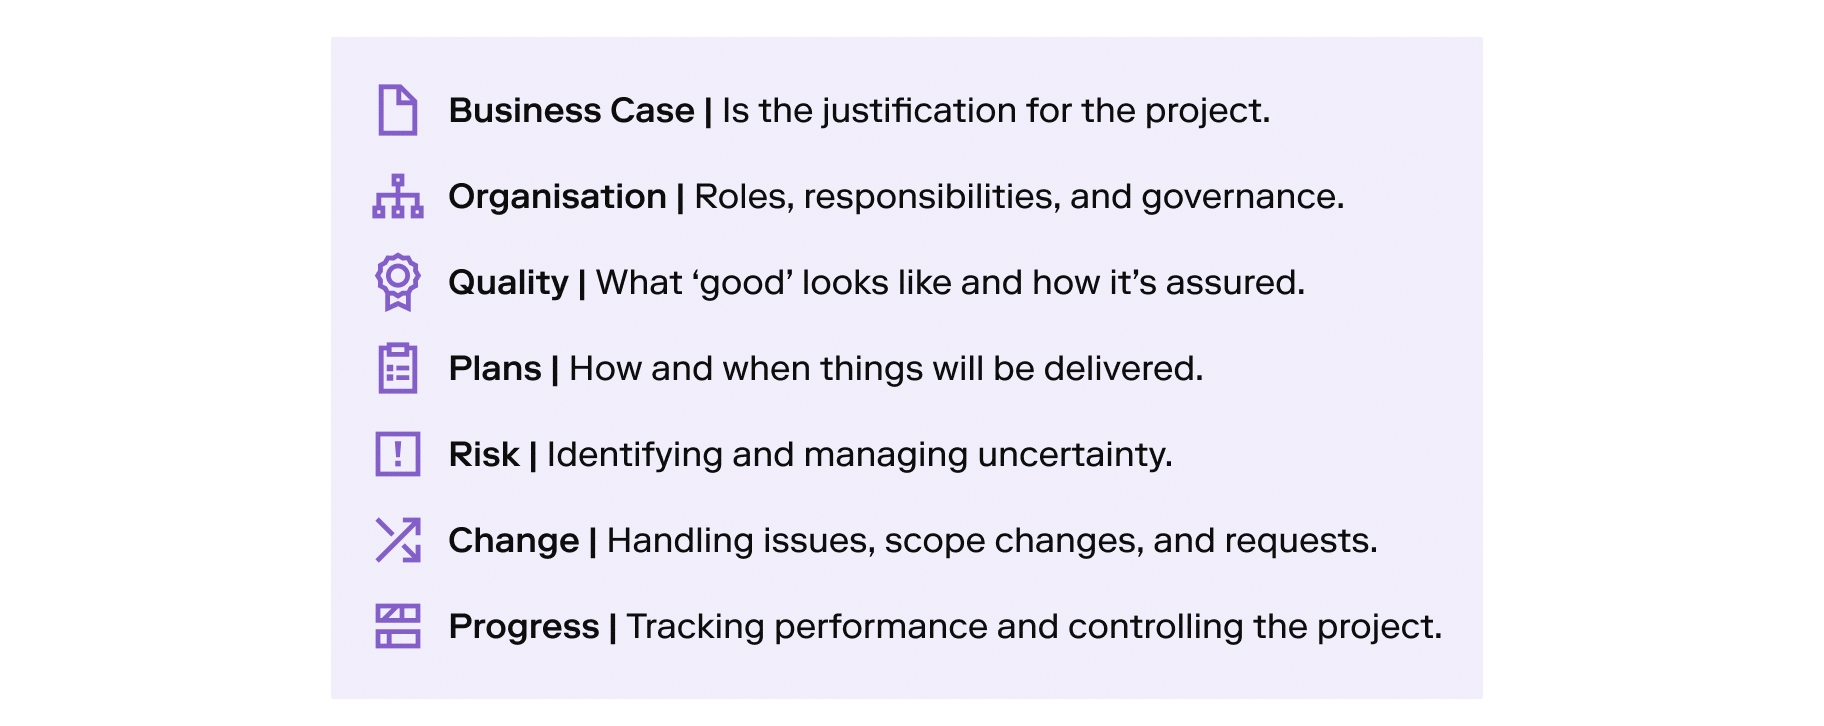
Frameworks such as Managing Successful Projects with PRINCE2 provide a useful structure for identifying balanced KPI sets across the full delivery lifecycle.
If we take the PRINCE2 themes, for example, this offers a fantastic opportunity to craft KPIs to provide full coverage of a project.
Recommended KPIs for a strategic PMO
The themes above can be crafted into KPIs for projects. The instinctive reaction is to create lagging indicators for these to track performance. However, lagging and leading indicators can be created for all of the above-mentioned themes.
Below are recommendations for some powerful KPIs which encompass all elements of delivery. These will not only provide value to the delivery teams but also critical visibility and insight for PMOs.
The list below provides guidance and it will be incumbent on organisations to tailor this to suit their needs. Also, there may be value in phasing the roll-out so that there’s time for teams to adjust.
KPIs for a Business Case
Is the justification for the project and articulates the value that is expected to be delivered by the project.
| Lagging Indicators | Leading Indicators |
| Actual benefits realised vs planned. | Forecast vs approved benefits variance (%). |
| Return on Investment (ROI) achieved post-implementation. | Benefit delivery confidence score (qualitative from stakeholders). |
| Payback period achieved vs planned. | Dependency readiness for benefits (e.g., operational changes, training readiness). |
| Type | Example | Value Proposition |
| Leading | Forecast benefits trending 15% below baseline due to delayed system adoption. | Flags the erosion of value early, allowing intervention before the project becomes a sunk-cost exercise. |
| Lagging | Only 60% of expected cost savings realised, six months post go-live. | Confirms whether the project delivered actual value rather than just outputs. |
Measuring organisation through KPIs
Covers roles, responsibilities, and accountabilities including decision making structures.
| Lagging Indicators | Leading Indicators |
| Escalation frequency / unresolved conflicts. | Decision turnaround time (e.g., Average duration (in days) for key decisions to be made). |
| Stakeholder satisfaction scores. | Stakeholder engagement level (e.g., Workshop attendance, participation rates). |
| Team attrition rate. |
| Type | Example | Value Proposition |
| Leading | Steering committee decisions taking 10+ days which is resulting in early governance bottlenecks. | Identifies governance friction before it impacts delivery speed and morale. |
| Lagging | High attrition in the delivery team is linked to unclear accountabilities. | Shows whether the project team structure is working effectively. |
KPIs as an indicator for quality
Measures what ‘good’ looks like and how this will be measured.
| Lagging Indicators | Leading Indicators |
| The volume of post-release defects / incidents. | The occurrence of defects during testing phases. |
| Total rework effort (As a % of initial effort). | The first-time pass rate for deliverables. |
| Occurrence of customer/user-reported issues. | Quality review coverage (% of products reviewed vs planned). |
| Type | Example | Value Proposition |
| Leading | Drop-in first-time pass rate from 85% → 60% signals declining quality discipline. | Highlights quality risks early, when they are cheapest to fix. |
| Lagging | Spike in production defects after go-live. | Measures the true cost of poor quality and missed controls. |
Measure your planning ability
How and when outputs will be delivered on the project.
| Lagging Indicators | Leading Indicators |
| Percentage of milestones achieved on time. | Schedule variance trend (Early-stage slippage patterns). |
| Schedule Performance Index (SPI). | The percentage of tasks that start late. |
| Final delivery vs baseline (time/cost variance). | Resource utilisation vs plan (Were the team over- or under-allocated). |
| Type | Example | Value Proposition |
| Leading | Consistent 2–3 day delays in task starts across multiple workstreams. | Gives early warning of schedule drift before milestones are missed and corrective action can be taken. |
| Lagging | Project delivered three months late vs the approved baseline. | Provides insights into planning accuracy and execution discipline. |
KPIs for risk handling
The process of identifying and managing uncertainty.
| Lagging Indicators | Leading Indicators |
| Number of realised risks that eventuated into issues. | Number of new risks identified per period. |
| Impact of realised risks (cost/time/quality impact). | Percentage of risks with mitigation plans in place. |
| Effectiveness of mitigations (planned vs actual impact). | Risk exposure trend (aggregate risk score over time). |
| Type | Example | Value Proposition |
| Leading | Decline in risk identification may indicate a possible under-reporting culture leading to risk visibility problems. | Encourages proactive risk management, not reactive firefighting. |
| Lagging | The number of major risks realised, resulting in a 20% budget overrun. | Shows how well the project managed uncertainty. |
Measures of change
The process to handle issues, scope changes, and requests.
| Lagging Indicators | Leading Indicators |
| Approved vs rejected change ratio. | Number of change requests being raised and the trend. |
| Impact of changes on cost/schedule. | Average time to assess and approve changes. |
| Number of late-stage changes. | Scope stability index (how much change has been factored into the project). |
| Type | Example | Value Proposition |
| Leading | A sudden spike in change requests may have been caused by unclear requirements or stakeholder misalignment. | Signals scope volatility early, before it derails delivery. |
| Lagging | High volume of late-stage changes increased delivery costs by 25%. | Reveals how well scope was controlled and governed. |
Track progress with KPIs
How will progress be tracked and the project controlled.
| Lagging Indicators | Leading Indicators |
| Actual vs planned progress. | Earned Value trend (early CPI/SPI movement). |
| Number of exceptions raised. | Work package completion rate vs plan. |
| Stage delivery success. |
| Type | Example | Value Proposition |
| Leading | CPI trending downward over three reporting periods. | Provides forward visibility on performance against approved tolerances. |
| Lagging | Multiple exception reports raised due to tolerance breaches. | Confirms whether the project remained under control or required intervention |
Next steps
Projects rarely fail without warning signs. The challenge is that many organisations only measure the signs after the outcome is already known.
Lagging indicators tell us whether we succeeded. Leading indicators tell us whether we are likely to succeed.
Mature PMOs understand that true delivery excellence comes from balancing both perspectives, using KPIs not as passive scorecards, but as active tools for governance, forecasting, and decision-making.
Ultimately, the most valuable KPI frameworks are not the ones with the most metrics. They are the ones that help organisations ask better questions, make better decisions, and deliver better outcomes.